Multiparametric Processing
Introduction
The past decade has seen some significant new developments for seismic processing and earth imaging. A new method that does not depend in the subsurface velocity model is known as Common Reflection Surface method or CRS. The CRS method instead of using the velocity as a model parameter, as the NMO based processing, uses the reflection events in the time domain and tries to obtain as much information as possible from the seismic data itself. Since the method is mainly driven by the seismic information is commonly known as a "data-driven" of "model-independent". The advantages of such method are that it uses a more genera travel time formulation, thuat naturally allows stacking more traces given a CMP point. The increased number of traces/fold produces images of the subsurface with a highly improved signal to noise ratio. The stacked section facilitates the interpretation work and brings back seismic events that can be hidden while using conventional NMO/DMO methods.
CRS Stack
The principle goal of CRS stack is to create an accurate approximation of the zero-offset section with high signal-to-noise ratio. This is achieved by summing or stacking a large number of traces that comprises more than one single CMP, but whose sources and receivers are within a certain vicinity of the midpoint position. Since the traces being stacked no longer belong to the same CMP gather, such procedure requires a more general traveltime formula that one used in conventional NMO stacking.
The CRS stacking operator, in a 2D situation, depends on a stacking parameter triplet that is determined in an automatic way by means of a search and coherency analysis procedure. Furthermore, the CRS stacking operator is independent of velocity information. The three parameters are:
Emergence angle (
ß
).
Curvature of the wavefront of the Normal-Incidence-Point wave (
K
NIP
).
Curvature of the wavefront of the Normal wave (
K
N
).
ß
is the emergence angle of a ZO ray at CMP point (x
0
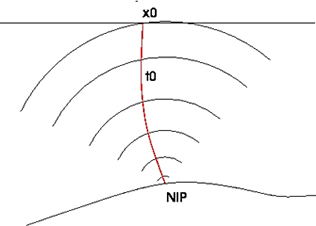
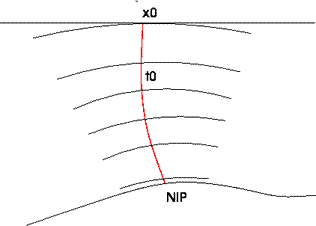
). The NIP wave front is formed by a point source placed at the point R of Figure 1. The N wave front is formed in an exploding reflector scenario, see Figure 2.
Figure 1
. Normal Incidence Point (NIP) wave front produced by a point source.
Figure 2
. Normal (N) wave front produced by a exploding reflector experiment.
CRS Versus NMO Traveltime
As the classical NMO method, the CRS method leads to simulated zero-offset (ZO) sections for points of interest along the seismic line. Each ZO trace location, called a
central point
, is specified by its (midpoint) coordinate,
X
0
, along the seismic line. Both methods, NMO and CRS, gives rise to a simulated ZO trace at
X
0
by stacking the data at each time sample
t
0
.
In the NMO method, the stacked value corresponding to (X
0
, t
0
) is obtained taking into account the traces of a single CMP gather that refer to X
0
. The stack is performed along a traveltime curve :
where
h
is the half-offset of the source-receiver pair under consideration and
V
NMO
is the NMO-velocity associated to the point (X
0
, t
0
). The parameter V
NMO
is estimated applying a coherence (e.g., semblance) analysis to the CMP gather related to X
0
. This procedure is generally known as
velocity analysis
and is performed for a few user-selected time samples only. These correspond to key reflection events that are manually picked by the interpreter. The NMO-velocity values at the remaining time samples are obtained by simple interpolation, yielding the V
NMO
values for the whole ZO trace at X
0
.
The NMO method has well-known advantages: enhancement of signal-to-noise ratio and attenuation of undesirable events. However, it has two drawbacks: the coherency (or velocity) analysis is restricted to CMP gathers, which encompass only part of the available data and the need to manually pick the data on selected events. The CRS method, does not have such drawbacks and preserves the good features of the NMO method. It applies the
multiparametric hyperbolic traveltime moveout
given by:
for all sources and receivers in an appropiate neighborhood of the central point, X
0
. In the above formula,
x
denotes the midpoint coordinate of the source and receiver pair for which the traveltime is computed. As a result, the
CRS method makes a better use of the available data
, because such neighborhoods contain significantly more traces than the CMP gather. Moreover, the CRS method is fully automatic and does not depend on the manual specification of NMO velocities.
CRS Benefits
Potential benefits of the CRS method as compared to the traditional NMO/DMO method of time imaging can be described as follows:
Stacking a large number of traces belonging to different CMP gathers increase signal-to-noise ratio. The stacked section facilitates the interpretation work and brings back seismic events that can be hidden while using conventional NMO methods.
Simultaneous determination of curvatures and emergence angle makes it possible to recover dip-independent V
NMO
through a simple algebraic equation:
As CRS works in a fully automatic way, the "picking" is done trace by trace and sample by sample, producing a sharper image and parameter sections (including V
NMO
section).
Example 1: NMO/MPT stack comparison (Land dataset)
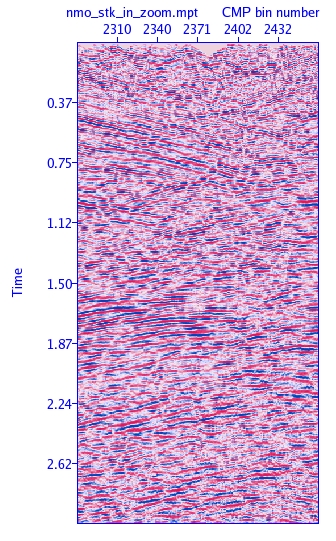
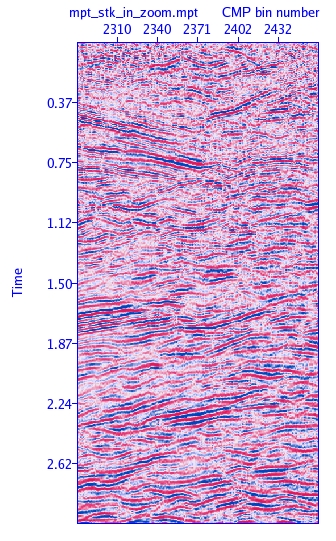
The images bellow correspond to a structural complex zone in VSM basin (Colombia). Figure e1.1 shows the NMO stack, obtained from a industry standard NMO based software, and Figure e1.2 shows the stack using our multiparametric based software (MPT).
As can be seen, the MPT stack section presents less aleatory noise, better continuity of the primaries and shows events that are hidden in the NMO stack section.
Figure e1.1
: Conventional NMO stack.
Figure e1.2
: Multiparametric stack.
Example 2: NMO/MPT stacking velocities comparison (Marine dataset)
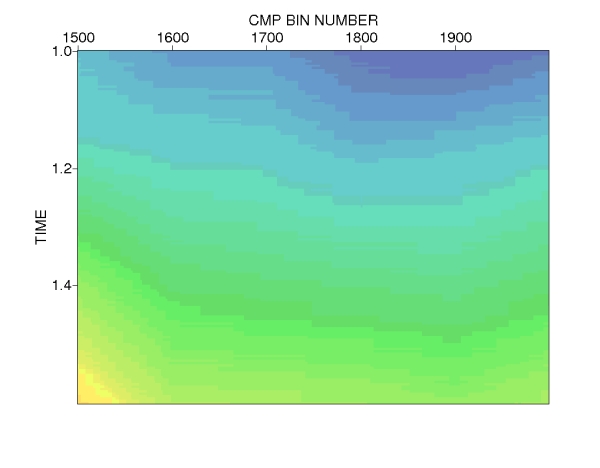
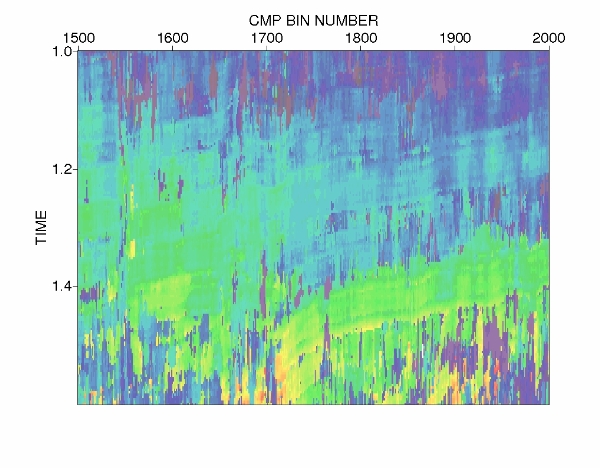
Figure e2.1
: Stacking velocity from conventional manual picking done by NMO method (left) and from multiparametric processing (right).
Click images to enlarge
.
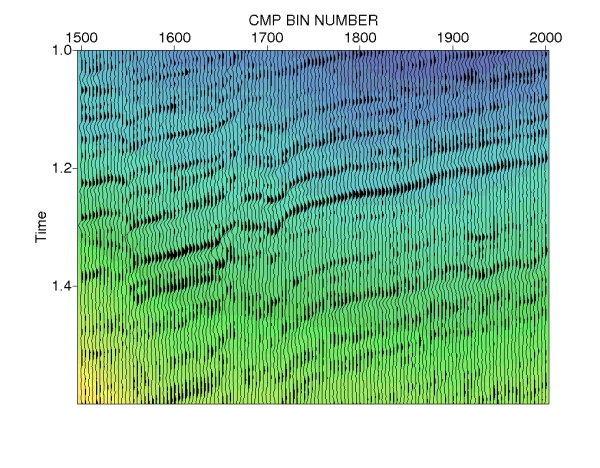
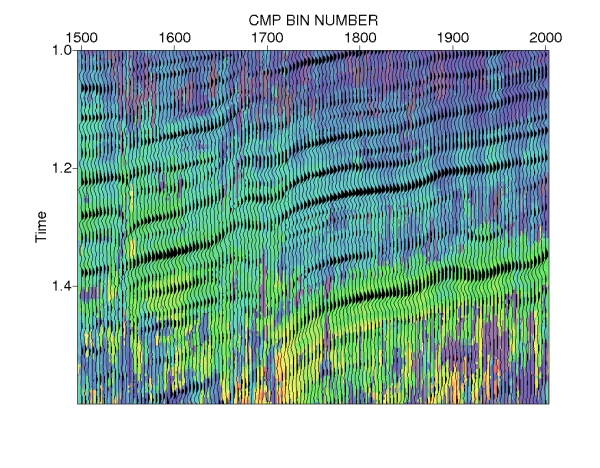
Figure e2.2
: Stacking velocities overlay with stack image from NMO method (left) and from multiparametric processing (right). Observe that the velocities from multiparametric processing follows the reflection events and are sharper that its counterpart.
Click images to enlarge
.
References
Majana, F. 2005. Tiempo de tránsito multiparamétrico CRS: definición y aplicaciones. Unpublished.
Majana, F., Mascarenhas, W. and Tygel, M. 2003. Parameter estimation of the Common Reflection Surface method: The refinement step: Revista Brasileira de Geofísica,
21
, no. 3, 275-286
Tygel, M., Müller, Th., Hubral, T. and Schleicher, J. 1997. Eigenwave based multiparameter traveltime expansion: 67th Annual Internat. Mtg. Soc. Expl. Geophys., 1770-1773.
Contact Information
NUMERICA LTDA
info@numerica.com.co
Phones: +57 (1) 347 4238 / +57 (7) 657 6894